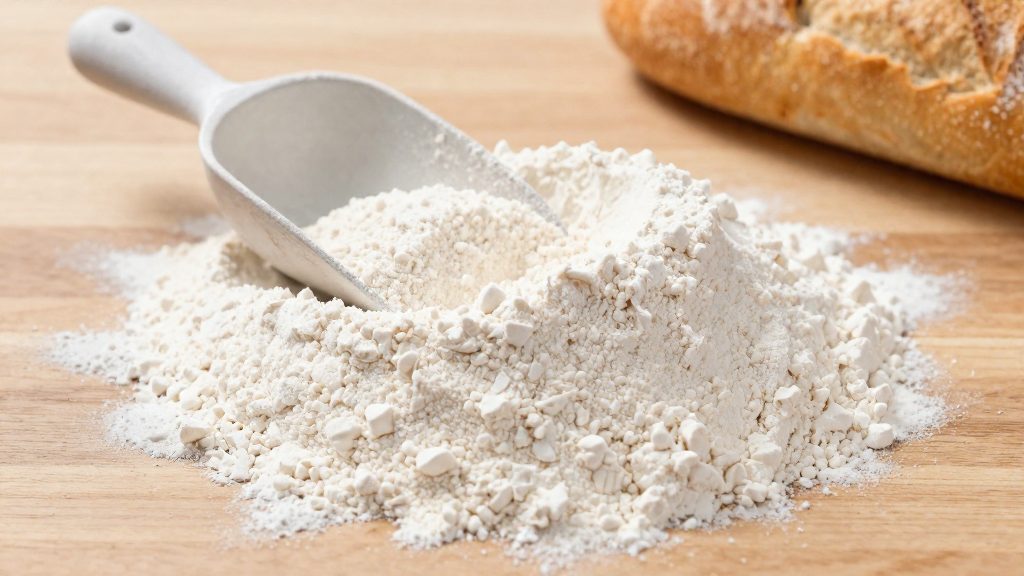
Bread flour generally contains 12–14% protein, according to WebstaurantStore (2024). That range is the working benchmark when a recipe calls for bread flour. The sources consulted do not set a single fixed cut-off. King Arthur Baking (2020-09-02) lists its bread flour at 12.7% protein and its all-purpose flour at 11.7%, which shows how close the two categories can sit.
What protein level counts as bread flour?
The sources consulted define bread flour by its protein content, and the usual figure they give is 12–14%.
Typical bread flour range
| Flour | Protein content | Source |
|---|---|---|
| Typical bread flour | 12–14% | WebstaurantStore (2024) |
| King Arthur Baking bread flour | 12.7% | King Arthur Baking (2020-09-02) |
| King Arthur Baking all-purpose flour | 11.7% | King Arthur Baking (2020-09-02) |
WebstaurantStore describes 12–14% as typical, not as a rule that applies to every bag. King Arthur’s bread flour, at 12.7%, sits near the lower end of that band, while its all-purpose flour falls just below it. A flour within 12–14% therefore fits the usual bread flour profile, and a figure below that band points toward a lighter, all-purpose style flour.
How protein percentage is measured on labels
The official sources consulted do not specify the laboratory method behind label protein figures, nor the moisture basis on which they are reported. What a label gives you is a single stated percentage for that specific product. Treat it as the manufacturer’s own figure and use it to compare products directly, rather than assuming a standard was applied across brands.
Why bread flour labels differ between brands and countries
The sources consulted do not explain why bread flour labels differ between brands or countries. They do show that the same category can carry different numbers: King Arthur’s bread flour and all-purpose flour are 1 percentage point apart, so the boundary between categories depends on each producer’s stated figures.
How does protein shape chew and crispness in bread and pizza?
The chew in a bread or pizza crust comes from the gluten network that forms inside the dough, and the amount of protein in the flour sets how strong that network can become. Wheat flour contains proteins that link together once they are hydrated. Stronger links produce a web that holds gas during fermentation and keeps its shape in the oven. This is why bread flour is the usual choice for chewy loaves and many pizza doughs.
How gluten forms from hydrated protein
Gluten develops in stages, and each stage changes how the dough handles gas:
| Stage | What happens to the gluten network |
|---|---|
| Mixing | Flour proteins absorb water and begin to bond |
| Kneading | Bonds multiply, and strands align into a continuous, elastic web |
| Bulk fermentation | The web stretches around the gas bubbles yeast and bacteria produce |
| Baking | Heat sets the structure, and the trapped gas expands |
Gas trapping and oven spring
Gas trapping is the core function of the network. King Arthur Baking (2020) notes that higher-protein flour forms more gluten and absorbs more liquid, producing a stronger, more elastic dough. That post discusses cookies, so the principle is best read as general dough behavior, not a crust-specific finding. WebstaurantStore (2024) states that the strong gluten network in bread flour traps gas and is associated with a chewy crumb and a crisp crust in artisan-style breads.
In the oven, the gas expands before the proteins set. A strong network stretches to accommodate this, allowing the loaf to rise quickly, a stage called oven spring. A weak network tears, and the dough loses volume.
Why the exterior is crisp and the crumb stays chewy
The crust and crumb dry at different rates. The surface loses moisture to the hot air and browns, which makes it crisp. The interior stays hydrated, and its gluten strands remain elastic, which gives the chewy texture. Strong gluten keeps the crumb open and springy rather than dense.
Is higher protein always better?
Not always. More protein lets bread flour form more gluten, which can improve chew and crust, but only up to a point. The sources consulted do not say where extra protein stops helping, so treat the usual bread flour range as a practical guide rather than a reason to chase the highest number. The right protein level depends on the bread style and the baking goal, not on the highest number on the bag.
Where the gains level off
The sources consulted do not specify a protein level above the usual bread flour range where improvement stops, so treat the upper end as a practical limit for most home baking rather than a target to exceed. The gap between a bread flour and an all-purpose flour is also modest:
| Flour | Protein | Source |
|---|---|---|
| King Arthur bread flour | 12.7% | King Arthur Baking (2020) |
| King Arthur all-purpose flour | 11.7% | King Arthur Baking (2020) |
| Typical bread flour range | 12–14% | WebstaurantStore (2024) |
The King Arthur figures differ by one percentage point, a small gap on the label.
When excess gluten makes bread tough and dense
Gluten development is the main reason higher protein can backfire. Elasticity helps an open, chewy crumb, but a network that is worked too long, or shaped too tightly, resists stretching. The loaf may then bake up dense and close-textured rather than airy.
Matching protein to the bread style
Matching protein to style comes down to the crumb you want. For open-crumbed, chewy loaves, bread flour is the natural choice. For softer sandwich loaves, where tenderness matters more than structure, a lower-protein flour may suit better. For pizza bases, the same trade-off applies, so testing a lower-protein flour alongside bread flour is the simplest way to see which texture you prefer.
Bread flour vs all-purpose flour for crust
Bread flour and all-purpose flour produce different results, but the sources consulted describe the gap as one of degree and give no measured crust comparison. Bread flour is milled to support a stronger gluten network. All-purpose flour is a more general-purpose blend, so the same loaf made with it tends to come out softer and less structured. Swapping one for the other changes the result, but a well-made loaf can still come out well with either.
Gluten strength drives most of the difference. A dough built on a stronger network holds gas better during proofing and bakes into a more open, springy structure.
| Factor | Bread flour | All-purpose flour |
|---|---|---|
| Gluten network | Stronger, holds more gas | Weaker, holds less gas |
| Expected crumb | Chewier, more open | Softer, tighter |
| Crust | Tends toward a crisp, sturdy finish | Tends toward a thinner, more tender finish |
| Liquid absorption | Higher | Lower |
Expected loaf texture when swapping all-purpose for bread flour: if you replace all-purpose with bread flour in a recipe written for the lower-protein flour, expect a firmer, chewier crumb and a more elastic dough.
When all-purpose flour is an acceptable substitute: for simple sandwich loaves, flatbreads, and quick breads, all-purpose flour works well, and the crumb will simply be softer. Expect a less pronounced chew and a more tender crust. If you want a crisper, more rustic crust, bread flour is the better choice.
Brand protein percentages to compare
The most direct way to compare flours is to read the protein percentage printed by the manufacturer. King Arthur Baking (2020) lists its bread flour at 12.7% protein and its all-purpose flour at 11.7% protein. These are the only two brand-specific figures in the sources consulted for this section, so they form the clearest published pair for a side-by-side check.
| Flour | Published protein | Reference |
|---|---|---|
| King Arthur bread flour | 12.7% | King Arthur Baking (2020) |
| King Arthur all-purpose flour | 11.7% | King Arthur Baking (2020) |
| Typical bread flour range | 12–14% | WebstaurantStore (2024) |
Placed against the 12–14% range, King Arthur’s bread flour falls in the lower half of the band, while its all-purpose flour sits just below it. Both figures are close to the boundary, so a single point of difference is a small change on paper but still measurable on a label.
The sources consulted do not list protein percentages for other brands. To extend the comparison, use the figure on each product’s own label or manufacturer sheet, and keep the steps consistent:
- Find the protein figure in the nutrition information or product specification, not in marketing text.
- Compare only products whose manufacturers state protein as a percentage, and keep in mind that the sources do not say whether the moisture basis is the same across brands.
- Place each figure against the 12–14% range to see where the flour sits.
- Record the flour name, the figure, and the source together, so the comparison can be checked later.
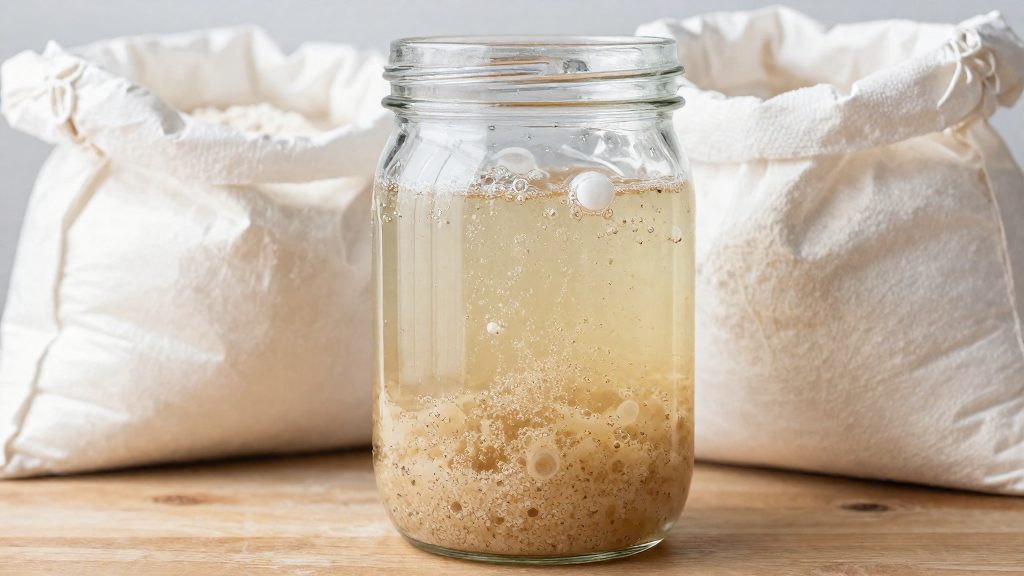
How hydration and fermentation change the chew
Chewiness in bread comes from the gluten network that forms when wheat proteins hydrate and bond. Flour protein sets how much network is possible, but water content, fermentation time, and resting steps decide how that network behaves in the dough. The effects below are general baking principles, and the sources consulted do not specify exact hydration percentages or fermentation times for each flour.
Hydration and water absorption
Water absorption is one lever on chew. Because higher-protein flour absorbs more liquid, a dough made with bread flour will feel stiffer than the same ratio made with a lower-protein flour. Bakers often find that a dough needs more water, or more rest, before it reaches a workable texture.
- More water loosens the network, making the crumb more open and the dough easier to stretch.
- Less water produces a tighter dough that holds shape but can feel dense if it is not developed enough.
- Water should be adjusted by feel: a dough that tears when stretched usually needs time or water.
Fermentation time and gluten extensibility
During fermentation, enzymes and acids produced by yeast and bacteria gradually change gluten. The dough becomes more extensible, meaning it stretches further before tearing. Early in fermentation, the dough is tight and elastic. As it ages, it relaxes, and the gluten bonds that trap gas can stretch more evenly.
Too much fermentation weakens the structure. The dough becomes slack, loses its ability to hold gas, and the crumb can turn gummy rather than chewy. The right point depends on the flour, temperature, and recipe, so the dough’s extensibility and gas-holding behaviour are the best guides.
Autolyse and dough strength
Autolyse is a rest in which flour and water are mixed and left to sit before salt and yeast are added. During this rest, the flour hydrates fully and gluten bonds form without mechanical work. The result is a stronger, more cohesive dough that needs less kneading to develop its network.
Autolyse also gives the dough a smoother texture and better extensibility at the start of fermentation. Because the network is already partly formed, a rested dough usually produces a more open crumb than one mixed straight through. The sources consulted do not specify a standard autolyse duration, so bakers usually adjust the rest based on flour behaviour and room temperature.
Which flour for pizza and which for sourdough?
Pizza and sourdough both depend on a flour that builds a strong gluten network, but they put different demands on it. The reference point here is bread flour. The official sources consulted do not specify a protein range for Neapolitan-style pizza, so treat the bread flour range as a starting point and judge the dough by how it handles.
Home pizza
Bread flour, typically 12–14% protein, is associated with a chewy crumb and a crisp crust in artisan-style breads, so it is a reasonable starting point for home pizza. The sources consulted give no pizza-specific protein range.
Long, cold-fermented sourdough
A cold fermentation lasts many hours in the refrigerator, so the flour has to keep its structure through a slow rise. Bread flour is a reasonable starting point for this process, but the sources consulted give no flour guidance specific to long cold fermentation. The official sources consulted do not specify a protein figure for long, cold-fermented sourdough, so choose the flour by how the dough holds its shape during the rise.
Adjusting for a high-heat pizza oven
A high-heat oven sets the crust quickly. Because of this, the dough needs to have developed enough structure before baking, and flour choice should reflect that. The sources consulted give no oven-specific flour guidance, so start with bread flour and judge the dough by how it handles.
How to test a flour at home
You can compare bread flours at home without lab equipment by checking three things: how the dough develops, how each flour rises and bakes under identical conditions, and how you record the results. Bread flour is generally the higher-protein choice for chewy bread. The tests below show how each flour performs in your own kitchen.
Windowpane test for gluten development
The windowpane test shows how far the gluten has developed. Knead each flour until the dough is smooth and elastic, then pinch off a small piece and stretch it slowly between your fingers. Keep the kneading stage the same for every flour.
- A well-developed dough stretches into a thin, translucent sheet that lets light through without tearing.
- A dough that tears early has weaker gluten.
- Note where the dough tears, if it does, and how much it stretches before failing.
Side-by-side bake comparison
Bake each flour in the same batch so that only the flour changes. Use the same recipe, mixing method, proofing environment, and oven. Shape the loaves identically and bake them on the same rack.
Recording rise, crumb, and crust
Use a simple log so the comparisons stay consistent from one bake to the next.
| Criterion | What to record |
|---|---|
| Dough at windowpane stage | Stretch quality, and whether it tears early or late |
| Rise | Loaf height and volume compared with the other loaves in the batch |
| Crumb | Open or tight, even or irregular holes |
| Crust | Colour, thickness, and crispness after cooling |
Photograph each loaf cut open, from the same angle and in the same light, so you can compare the crumb later.
Frequently asked questions
Does more protein always mean a chewier crust?
The sources consulted do not say where extra protein stops helping. WebstaurantStore (2024) links a strong gluten network to a chewy crumb and a crisp crust in artisan-style breads, while King Arthur Baking (2020-09-02) notes that higher-protein flour absorbs more liquid, a point it makes about cookies rather than crust.
What protein range should I look for in bread flour?
WebstaurantStore (2024) describes 12–14% protein as typical for bread flour, not as a fixed limit. The sources consulted give no pizza-specific range, so check the percentage the manufacturer publishes on its website or spec sheet.
Can I compare two flours using their protein numbers alone?
King Arthur Baking (2020-09-02) lists its bread flour at 12.7% protein and its all-purpose flour at 11.7%, a difference of one percentage point. The sources consulted do not measure how that difference affects crust color or chew, and they do not say whether the moisture basis behind label figures is the same across brands.